Monday, December 26, 2011

Income Disparity and Other Countries - OECD Data

Although the US continues to have one of the highest levels of income disparities in the developed world, the growth in income disparity has been about as great or greater in other countries, including those with substantially different economic and social systems, including Israel, New Zealand, Germany, France, Finland and Sweden.


So, to the extent this is a problem in the U.S., we are not alone in it getting worse.


The only country that showed a decline in income disparity was Greece, perhaps due to their financial system cratering which, I suppose, is one way to solve the problem.


The OECD chart below gives the relevant data - increases are shown by the distance between the top of the blue lines and the red diamonds.


See the OECD Report at www.oecd.org/document/40/0,3746,en_21571361_44315115_49166760_1_1_1_1,00.html

Tuesday, December 20, 2011

Income Inequality, Public Perception and Actual Data

With the rise of the Occupy movement (relatively quiescent now, after many evictions from public spaces), income and/or wealth inequality has become the issue de jour in some circles, even resulting in mention in recent speech by the President.


Putting to one side the fact that there have been relatively few specific proposals by any pubic officials to address income differentials in America, a question remains:  How much are Americans actually concerned about this issue?


The answer, it appears, according to a recent Gallup Poll (www.gallup.com/poll/151568/Americans-Prioritize-Growing-Economy-Reducing-Wealth-Gap.aspx), is: 


Not as much as some might expect.


When asked to rate the relative importance of government policies in various areas, here were the results regarding percentages rating such policies as extremely important:


Grow and expand the economy - 32%


Increase the opportunity for people to get ahead if they want to - 29%


Reduce the income and wealth gap between rich and poor - 17%.


Apparently, Americans remain strongly supportive of economic growth and equality of opportunity, but not of government steps to reduce the outcome of income or wealth disparities.


As the Gallup survey notes in its summary - "It is clear that while some Americans, disproportionately Democrats, consider it important that the federal government enact policies to reduce the income and wealth gap, many more Americans consider it important that the government grow the economy and increase the equality of opportunity."


A separate Gallup question found that "the fact that some people in the United States are rich and others are poor" is deemed "an acceptable part of the economic system" by 52% of those asked, a reversal from the last time the question was asked (in 1998) when 52% said that it was "a problem that needed to be fixed."


 So, while steps to reduce income/wealth differentials may or may not be good policy (some differentials being an inherent part of any free market system - George Clooney will always make more than Joe the Plumber), it seems clear that support for proposals to reduce such disparities are, relatively speaking, simply not a high priority for most Americans.


In that regard, it may be that the Occupy activist's priorities are shared by only a small proportion of most Americans.


Tuesday, December 13, 2011

Liberalism and Public Perception

Political discourse moves on a number of different levels.  


The short-term level is the one we most often see in the media, perhaps due to the media's self-imposed pressure to have something to talk about in between elections.  The reporting on a candidates recent troubles, or yesterday's Occupy demonstrations, probably fall into this category.


The mid-term focus is, understandably, on such things as active campaigns and elections:  Who won what and why, and what the prospects are for significant policy changes.


Often ignored are the longer-term forces in play, such as demographics, systemic changes in the economy and government's role, such as the growth of entitlement spending.  It's certainly arguable that these forces have at least as much impact on public policy and politics as any of the shorter term movements, even if they are not regularly highlighted in the media.


It's those longer-term forces that I find most interesting and a recent graph from the Gallup organization highlights some of the systemic problems which face those urging a greater role for government in our society.  See the graph below.


Looked at long-term, this dataset has a number of interesting lessons for us:


First, concern about a larger government role has grown with time.


Second, that concern has, throughout the period studied, been at a higher level than concerns over business or labor power.


Third, that concern is now at a level which is the second highest in the period studied, and is only one percentage point below the historical high.  What makes this remarkable is that this is true even in an era of a poorly performing economy, from the standpoint of job creation, and during a period of concern over income inequality.


What is perhaps more surprising is that concern over big government is the leading concern, not merely among Republicans (as one would expect) and independents, but even among self-identified Democrats!


What this means for the upcoming election is something I'm not competent to analyze, but it will be interesting to see how this impacts any possible effects of the Occupy Wall Street movement.  


As the Gallup report notes:


"The Occupy Wall Street movement, focused on 'fighting back against the corrosive power of major banks and multinational corporations,' has drawn much attention and a large following. Still, the majority of Americans do not view big business as the greatest threat to the country when asked to choose among big business, big government and big labor.  In fact, American's concerns about big business have declined significantly since 2009.


Similarly, these are daunting numbers for anyone advocating an increased government role, such as those favoring a single payer system in health care.


The full Gallup report is at www.gallup.com/poll/151490/Fear-Big-Government-Near-Record-Level.aspx?utm_source=add%2Bthis&utm_medium=addthis.com&utm_campaign=sharing#.TuaETC1jbVs.twitter

Friday, December 2, 2011

Unemployment and Reality - Three Graphs

Courtesy of Derek Thompson at the Atlantic, here are a few datasets to keep in mind when reading today's news that unemployment had fallen to 8.6%.  (See the full article at www.theatlantic.com/business/archive/2011/12/86-unemployment-the-good-the-bad-and-the-mysterious-in-the-jobs-report/249394/)


1.  The job growth from the recent recession has been, and remains, historically low.  While we may at some time reach a point that shows that we've clearly turned the corner on job growth, this is not it.


Screen Shot 2011-12-02 at 9.29.08 AM.png


2.  The vital figure, the ratio of employment to population, remains very low and has not shown an upturn historically comparable to prior downturns.


http://product.datastream.com/economics/gateway.aspx?guid=23068abf-b1c0-421d-9450-40581d19451f&chartname=US%20employment%20to%20population%20ratio&groupname=Employment&date=20111202&owner=ZRTN179&action=REFRESH


3.  If job recovery improves at a rate reasonably comparable to past experience (average monthly job creation for the best year in the 2000s), we'll be back at full employment in about 15 - 20 years.


Screen Shot 2011-12-02 at 10.02.56 AM.png

Thursday, November 24, 2011

A Radical Thought from a Moderate Rationalist

Here's how Republicans or Democrats can win control of Congress in the next election.

 Republicans could introduce and support the tax increases the Democrats have demanded, with no strings or spending cuts attached.

or

Democrats could introduce and support the spending cuts Republicans have demanded, with no strings or tax increases attached.

Whichever party does this then says to the electorate: "We have demonstrated that we can govern. Now put us in control and we will solve the nation's problems."

Why the Supercommittee Failed

As we discussed in an earlier post, the incentives were simply not present to cause the supercommittee to make any hard choices or come up with any innovative solutions, whether on a "Grand Bargain," the $1.2 trillion sequestration or even a smaller step towards fiscal sanity.


But some other, parallel reasons existed for its failure and they're cogently explained in this post today by Ron Elving,  the senior Washington editor for NPR News.  The full post is at www.npr.org/people/1930203/ron-elving.


. . .  a democratically elected government is not a business. There is no business strategy, no business model and only limited agreement on what "the business" ought to be doing. Instead, the component parts of the business function independently and often at odds with each other. The analogy, in short, does not work.

So the dozen people on the deficit panel reverted in the end to the self-protective behaviors that characterize politicians under pressure. Realizing their various constituencies would be better off in the short run without a compromise requiring sacrifice of everyone, the two sides elected to punt. The plans they submitted to each other were more about conflict than compromise.
That is exactly the same dynamic that has kept Congress from doing anything productive about the deficit since the year 2000 . . . 
The problem at base is that the country has been told too many pleasant lies and too few uncomfortable truths by both its major political parties. It is not possible to go on having all the government we're used to (including entitlements and half the world's total defense spending) and blithely send the bill to somebody else (either in the present or the future). It can't continue and it won't.
. . .
Both parties act as though they can blame the other, striving to please constituencies that insist they do so. Yet, few achievements in American history have been so bipartisan as the national debt.
It took two centuries to reach $1 trillion and became a major campaign issue for Republican Ronald Reagan in 1980. In the three decades that followed, the debt rose from $1 trillion to $12 trillion. During that period, Republicans were in the White House two-thirds of the time. Both chambers of Congress had Democratic majorities for 12 years, Republican majorities for 10 years and 6 months and divided control for 7 years and 6 months.

Monday, November 21, 2011

The Supercommittee's Failure and the President's Responsibility

On this Monday, essentially all of the political and economic commentators in the land appear to have concluded that the supercommittee has failed in it's assigned task of finding agreement as to some combination of $1.2 trillion in increased revenues and/or spending cuts.  In fact, some of our earlier posts had contemplated precisely this outcome.


As has also been noted in earlier posts, the incentives needed to convince the parties to reach a deal were simply not present here, so the result is not surprising.


That said, and putting to one side the forthcoming political theater in which each side will blame the other (you may want to help your blood pressure by tuning out for the next 72 hours!), a few comments regarding the President's role, or non-role, in this process bear noting.


In real life in politics, serious budget deals get done when Presidents get directly involved, and use the leverage of their office to cajole, threaten and put pressure (especially of public ridicule) on both sides.  As another writer noted today, "A few phone calls and tepid public statements do not count. It is the executive, not the legislature, that gives the budget process energy and direction."


In fact, that's exactly what happened in the budget/tax deals which took place under Reagan, Bush 1 and Clinton.


I'm told that the Vice President's deficit talks earlier this year found about $400 billion in relatively easily identified budget cuts, while the Republicans recently put forward a relatively modest $300 billion in additional revenues.  Clearly, the ingredients were there for at least a mini-deal (say, $700 billion?), if not the hoped-for $1.2 trillion in revenues and/or cuts.


My experience, as a trained mediator and with 40+ years as a business attorney, is that when parties are more than half way to a deal, it's not unusual for them to be pushed all the way to a complete deal.


But it does take a push, and usually from someone other than the parties themselves.


But what happened was, once again, that the President absented himself from the rough work necessary to bang heads and seize the moment.  


Is it conflict aversion or something else?


I cannot but help be reminded of his earlier failures to push for fiscal balance when the Bush tax cuts were extended (which gave the Republicans what they wanted and caused the President to lose valuable leverage in the Summer debt ceiling debacle), which was in turn resolved by "kicking the can down the road" to the super committee.  Recall that in that case, what the President did achieve was to put off further debt ceiling discussions until after Election Day in 2013.  


Note also the decision in Afghanistan to begin withdrawals in advance of the election, perhaps also motivated by political considerations rather than military advice.  I may be self-delusional, but I do see a pattern here.


It seems clear that when the nation needs strong leadership from the President,at least in the fiscal arena, he has been found wanting.  Even from a non-partisan standpoint, and I hear this from my Democratic friends as well, we do not have a strong President.


Perhaps the President's campaign slogan in 2008 will be revived, but this time for use by the other side:  "Change we can believe in."


Friday, November 18, 2011

Why the Supercommittee May Not Matter

As a follow-up to some of our recent posts, an article in today's Washington Post (www.washingtonpost.com/politics/supercommittee-appears-unlikely-to-reach-agreement/2011/11/17/gIQAjk43VN_story.html?hpid=z3) makes it clear that it's reasonably likely that the fiscal "supercommittee" will not be able to reach agreement on spending cuts and, in fact, may not have much incentive to do so.


As Senator Max Baucus commented, "We’re at a time in American history where everybody's afraid — afraid of losing their job — to move toward the center. A deadline is insufficient."


For those with some memory on the subject, they'll recall that an impending government shutdown forced the first budget deal, in April of this year.  Then, in August, the possibility of a default was necessary for the compromise that resulted in the establishment of the supercommittee.


As the Post's article comments, "even normally optimistic aides close to the process conceded that it may be time to pull the plug."


So, let's assume that the supercommittee fails to reach agreement, as seems likely.  What happens next?


Well, here's a likely scenario:


1.  Each side blames the other.


2.  No cuts take place until 2013.


3.  The Democrats go into the 2012 election claiming that the Republicans want to dismantle Social Security and the safety net, while the Republicans claim that the Democrats will raise taxes on the middle class and spend the nation into bankruptcy.


4.  The 2012 election may be one of the few truly important elections in our history, at least from a fiscal standpoint.


Once again, we're reminded that the first law of economics is scarcity: people's demands for goods and services (including from government) is endless, as compared to the available supply.  


And the first law of politics is to ignore the first law of economics.

Thursday, November 17, 2011

Defense Spending and Some Perspective

When it comes to possible budget cuts, one area that receives attention is the Defense Dept. budget.


To put the current defense budget in perspective, let's look at a few charts, courtesy of The Foreign Policy Initiative (see www.foreignpolicyi.org/content/defense-spending-super-committee-and-price-greatness)


First, over the period since WW 2, the driver in increased federal spending has been entitlements, not defense.


Second, defense spending as a percentage of all federal spending is near an historic low.


Third, defense spending has already been subject to a series of reductions under the current Administration, with long-term cuts amounting to about $850 billion.  In a very real sense, the Defense Department may be able to say that it "already gave at the office."


May there still be some "fat" to be cut?  


Maybe.


Has the defense budget already taken significant cuts? 


Absolutely.

Sequestration and A Reality Check – Part Two

Let’s assume, perhaps out of an excess of pessimism, that the Supercommittee does not agree on $1.2 trillion in savings, the mandated cuts are triggered and no legislation passes avoiding such cuts.

How much money would actually be saved by the sequestration of the otherwise planned spending?

The answer, disappointingly, is: Not much.

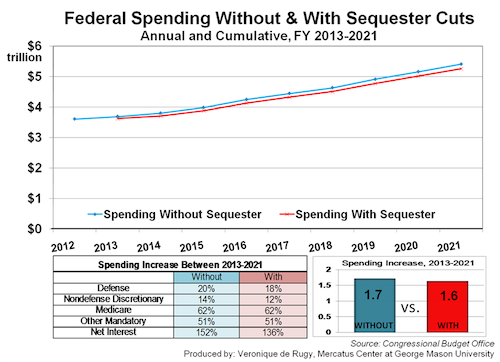
As a study (see http://mercatus.org/publication/federal-spending-without-sequester-cuts) by Veronique de Rugy at George Mason University shows, using Congressional Budget Office numbers, the “sequestration” of planned spending would result in total additional spending by 2011 of $1.6 trillion; without sequestration, the additional spending would be $1.7 trillion. 

So, the total effect of sequestration would be a reduction in spending of less than 6% and far less than the President’s Fiscal Commission recommended.

Examine her graph below, and if you can see the difference between the two lines, your eyes are better than mine:


The takeaway?  If the Supercommittee doesn't reach agreement, and the planned amounts are sequestered, we’re still headed off a financial cliff, albeit at a trot, rather than a gallop.

If they do reach agreement, but only to the extent of the otherwise sequestered amount, and fail to "think bigger," the same result applies.


It makes one wonder a bit as to what the fuss is about in the media re whether or not the sequestration trigger gets pulled.

Sequestration and A Reality Check – Part One


In this last week before the supposed deadline for the Supercommittee to resolve the issue of possible budget cuts, perhaps it’s a good time to do a reality check.

It’s a common belief, and I’d suggest an incorrect one, that if the Supercommittee fails to reach an agreement on $1.2 trillion in budget cuts over the next 10 years, there will be mandatory cuts in both the defense and non-defense budgets.

[Note that even if the Supercommittee does not each agreement, any “triggered” budget cuts will not take effect until 2013.]

Well, yes – on one level that’s what the deal was, as reached by the President and the Republicans this Summer, and as enacted by Congress (and signed by the President) at that time.

However what Congress does can be undone, subject only to a Presidential veto, which can (in turn) be undone by Congress.

Thus, if no agreement is reached, Congress could simply amend or repeal its earlier law mandating any “triggered” budget cuts.

Speculating, it seems unlikely that the President would veto any such acts of Congress, particularly if they were supported by many Democratic members of the House and Senate.

What would follow that is even more speculative, but I, for one, would hate to be any Congressperson running for re-election and who had voted in favor of kicking the can down the road, particularly if that triggered further downgrades in the government’s bond ratings.

Saturday, October 29, 2011

Dissatisfaction with ObamaCare Rises, Even Among Democrats

It's probably fair to say that one of the President's most important achievements was the passage of health care reform.  While some of us (the author included) felt that the reform did not go far enough, and remain skeptical of its ability to "bend the cost curve downwards," the effort was clearly one of the Administration's central priorities.


But how does the program play out with voters, given the impending 2012 battle over the President's possible re-election?


Well, the latest poll, by the non-partisan Kaiser Family Foundation (see www.kff.org/kaiserpolls/8251.cfm), gives us some data relevant to that question.  


That poll reports that support for ObamaCare has declined significantly, including (surprisingly!) among self-identified Democrats, the President's core constituency.


Here are some of the findings:


. . . this month's tracking poll found more of the public expressing negative views towards the law . . . 51% say they have an unfavorable view . . . while 34% have a favorable view.


The change in favorability this month was driven by waning enthusiasm for the law among Democrats, among whom the share with a favorable view dropped from nearly two-thirds in September to just over one-half (52%) in October.


Americans are more than twice as likely this month to say the law won't make much difference for them and their families as they are to say they'll be better off under the law . . . Here, too, changes in views among Democrats helped shape the overall change.


While the largest factor in voter's minds as the 2012 election approaches is likely to be the economy (and particularly the unemployment level), declining support for one of the President's signature programs, especially among his natural supporters, is not a good sign for him or fellow Democrats further down the ticket.

Politics as Usual?

As many of our readers will recall, in 2008 Senator Obama ran on a theme of "hope and change," which included a promise to desist from practicing politics as usual.  


Understandably, that excited the President's supporters and was probably a significant factor in the high level of energy, emotional support, precinct-level work and contributions evidenced by his followers.


However, the actual performance of that promise may have been compromised, as disclosed by a recent New York Times article (see www.msnbc.msn.com/id/45072966/ns/politics-the_new_york_times/#.Tqws1WDx-zs.)


Here are a few excerpts from that article, relating to contributors to the President's 2012 re-election campaign and various "bundlers" of contributions:

At least 15 of Mr. Obama’s “bundlers” — supporters who contribute their own money to his campaign and solicit it from others — are involved in lobbying for Washington consulting shops or private companies. They have raised more than $5 million so far for the campaign.

Because the bundlers are not registered as lobbyists with the Senate, the Obama campaign has managed to avoid running afoul of its self-imposed ban on taking money from lobbyists.

But registered or not, the bundlers are in many ways indistinguishable from people who fit the technical definition of a lobbyist. They glide easily through the corridors of power in Washington, with a number of them hosting Mr. Obama at fund-raisers while also visiting the White House on policy matters and official business.

. . . 

While none of the bundlers is currently registered as a federal lobbyist, at least four of them have been in the past. And a number of the bundlers work for prominent lobbying and law firms . . . 

Perhaps even more indicative of the continued strength of political realities is the fact that, as reported by the Center for Public Integrity and ABC News, (see www.iwatchnews.org/2011/06/15/4880/obama-rewards-big-bundlers-jobs-commissions-stimulus-money-government-contracts-and)

More than two years after President Obama took office vowing to banish “special interests” from his administration, nearly 200 of his biggest donors have landed plum government jobs and advisory posts, won federal contracts worth millions of dollars for their business interests or attended numerous elite White House meetings and social events

Nearly 80 percent of those who collected more than $500,000 for Obama took “key administration posts,” as defined by the White House. 

More than half the ambassador nominees who were bundlers raised more than half a million.

Here are some graphic expressions of the findings:


While it's certainly true that other Administrations have behaved similarly, it's worthwhile to note that while both the Bush (2) and Obama administrations have appointed about the same number of bundlers, Obama reached that figure in two years, while it took Bush eight years.

My reaction, then, is not that I'm surprised, or even particularly bothered, by the fact that, at least in this area, "politics as usual" continues to apply.  It's simply that it's difficult to reconcile behavior with rhetoric.

Or, to put it more simply, no voter likes sanctimony, particularly when it's false. 

Tuesday, October 18, 2011

Further on 9/9/9

Today the Tax Policy Center released its analysis of Mr. Cain's 9/9/9 proposal.


As analyzed by that group, adoption of the plan would result in lowered after-tax income (due to increased taxes) for all groups making less than $200,000 per year in income.  Taxpayers above $200,000 in income would actually see an increase in their after-tax income, due to lowered taxes.


For example, a household with $20,000 to $30,000 would see their taxes increase and an income drop of over 16%, a household with $40,000 to $50,000 would see an income drop of over 11% and a household with $200,000 to $500,000 would see an income increase of about 5%, all making the tax structure less progressive than it is today.


As noted before, this may be good or bad policy depending on your political and economic viewpoint, but is unlikely to attract the majority of voters in an economy where many people are already struggling.  


Tax the rich may sell politically; tax the poor never does.


The relevant analysis is at http://taxpolicycenter.org/numbers/displayatab.cfm?Docid=3221&DocTypeID=1

Thursday, October 13, 2011

The 9/9/9 Plan - An Analysis

As many of our readers already know, the 9/9/9 tax plan proposed by Republican presidential candidate Herman Cain has generated a fair amount of interest, some positive and some negative.  In fact, on a radio talk show last evening where Andy and I were guests, a number of the callers brought up the plan and wanted to know more.


So, let's start with some basics:


The plan would replace the current, extremely complex tax structure of varying marginal tax rates and a host of deductions (not all of which are available to all taxpayers) in the personal income tax code. The plan would, among other things, end the estate tax, the payroll tax (used to fund Social Security and Medicare), and the capital gains tax. 


Instead, individual taxpayers would pay a flat tax rate of 9 percent, irrespective of their income level, homeownership, number of children or otherwise; the only deduction would be for charitable giving. 


Businesses would pay corporate taxes at 9 percent, and, as something very new for Americans, there would be a new federal sales tax (in addition to any state or local sales taxes), also set at 9 percent.


Mr. Cain claims that the new tax structure would be revenue neutral - that is, it would collect for the federal government the same amount as the current structure provides.  


There's some debate as to that claim (a difficult debate to resolve, since the issue centers around how a new tax structure might change American's economic behavior, something that's perhaps unknowable at this point), but for purposes of this analysis, let's assume that it's correct.


One of the questions that arose on the radio show was: What the effect of this proposal would be on typical taxpayers?


To answer that, I went to the internet and the most cogent analysis of the proposal seemed to be that of Ezra Klein, of the Washington Post, of which I've reproduced highlights below.  (The full posting is at www.washingtonpost.com/blogs/ezra-klein/post/the-9-9-9-plan-for-an-average-household-and-for-a-wealthy-one/2011/08/25/gIQAGKYzhL_blog.html#excerpt.)


"I asked Edward Kleinbard, a tax law professor at the University of Southern California, to walk me through the tax burden for a typical family of four with an income of $50,000 in the current system and under Herman Cain’s plan. Before we get to the details, here’s the bottom line: Cain’s plan would increase the family’s tax bill by thousands of dollars.


Let’s start with the calculations for the current system. If you take the employer and employee side of the payroll tax, payroll taxes come to 15.3 percent of our hypothetical family’s $50,000 income.  Final bill? $7,650 in payroll taxes. But that’s almost all they’re going to pay in federal taxes.
When it comes time to fill out their federal income taxes, they take the standard deduction ($11,400), plus four personal exemptions ($3,650 each), plus two child-tax credits ($1,000 each), which leaves them paying $766 in federal-income taxes.
Total tax bill? $8,416.
Cain’s plan, by contrast, acts like a 27 percent payroll tax with basically no exemptions. To understand why that is, read my earlier post, or, if you really want the details, see Kleinbard’s full analysis. So here, too, the calculation is fairly straightforward: $50,000 x 27% = $13,500.
And that leaves us with simple subtraction. $13,500 - $8,416 = $5,084. That’s how much more a family of four with $50,000 in income and a very simple tax return would pay under Cain’s 9-9-9 plan.


. . .  let’s look at the other side of this, too. Take a family of four with $1,000,000 in income. I wanted to stop bothering Kleinbard at this point, so I just ran these numbers myself. Assume again that the family files a very simple tax return: standard deduction, four exemptions. According to Turbotax, they would owe $311,208 under the current system.
Cain’s plan is a bit tougher to apply to them. Many of his taxes are consumption-based, and it’s likely that this family would hold on to much of their income in any given year. But as the tax professors will tell you, all income is eventually spent, so all the income they make this year will eventually be taxed under the 9-9-9 plan.
If you grant that premise, then the calculation is no harder than it is for the family of more modest means: $1,000,000 x 27% = $270,000.  That means that the 9/9/9 plan is, for a household making $1,000,000, a tax cut of $41,208 ($41,208) . . . "
Assuming this analysis is correct, the 9/9/9 plan generates significant tax increases on the middle class, and significant tax cuts for the upper class.


Putting to one side any philosophic debate on tax "fairness," any tax plan like 9/9/9 is going to be a very tough sell for any presidential candidate, especially in a time of economic stress.


David Holmes


Tuesday, September 20, 2011

Taxes, Billionaires and the Actual Data

The President's recent tax and budget cuts proposal inspired me to go looking for some data, particularly given the assertion by some that "the rich just don't pay their fair share of taxes."


Well, fairness is in the eye of the beholder, I suppose (while I think it would be only fair if the Dodgers went to the World Series, since it's been so long for them, I'm sure my friends in San Francisco would disagree), but let's take a look at the data as to who actually pays what:


As of 2008 (the most recent numbers I found), the top 10% of taxpayers (by adjusted gross income) paid 69.94% of federal income taxes and the top 1% paid 38.02%.  


Now in large measure this is a function of the fact that the top 10% of taxpayers make a large share of the income; 45.6%, and the top 1% makes 17.7% of the total income, each according to the Paris School of Economics. (http://g-mond.parisschoolofeconomics.eu/topincomes/)  But the fact remains that high income earners pay a greater share of the personal income tax burden that their share of income itself would account for.


On the other hand, the bottom 50% (based on adjusted gross income) of taxpayers pays only about 2.7% of taxes paid. (Sources: www.taxfoundation.org/news/show/250.html#table6 and http://ntu.org/tax-basics/who-pays-income-taxes.html, both from IRS data)  


As to the federal tax burden on various income classes as a share of income (how deep does the tax dog bite?), as of 2007, the top 1% paid at an average rate of 29.5%, and the top 10% paid at an average rate of 26.7%.  


For comparison, the middle 20% (a reasonably good marker for “middle class”) paid at an average rate of 14.4%.  (Source: Congressional Budget Office - www.cbo.gov/publications/collections/collections.cfm?collect=13)


So, while I'll not attempt a definition of tax fairness here, the data seems to indicate that the rich pay a disproportionately high share of taxes and lose a significant portion of their income, as compared to other income classes.


Interestingly enough, a recent Washington Post Fact-Checker article (www.washingtonpost.com/blogs/fact-checker/post/obama-taxes-and-the-buffett-rule/2011/09/20/gIQAXdd0iK_blog.html#pagebreak) came to the same conclusion:


"When you add up all of the various taxes, and look at the effective tax rates, it is clear the tax system is already pretty progressive. 


Everyone pays some tax, even those who pay no federal income taxes, and the wealthiest pay a larger percentage share of taxes. 


Here’s the effective tax rate for all of the groups, according to 
the CBO:

Lowest quintile (23.4 million taxpayers), zero to $18,900: 4.3 percent
Second lowest quintile (22.4 million), $18,900-$32,100: 10.2 percent
Middle quintile (22.9 million), $32,100-$47,400: 14.2 percent
Fourth quintile (23 million), $47,400-$71,200: 17.6 percent
Highest quintile (23.6 million), above $71,200: 25.8 percent
Top 10 percent (12 million), minimum income of $98,100: 27.5 percent
Top 5 percent (5.9 million), minimum income of $134,400: 29 percent
Top 1 percent (1.1 million), minimum income of $332,300: 31.2 percent"
Finally, let's look at a chart comparing various 10-year tax revenue proposals, including the president's.  Compared to a world in which we did nothing (allowing the Bush tax cuts to expire, as current law allows), here's the chart comparing various proposals.


As you can see, the President's most recent proposal is for less of a tax increase than he proposed in April (in that sense, moving in the direction of the Republicans), as well as being less than half that of the President's Commission on the debt.


Draw what conclusions you wish, political, moral or otherwise, but the data set out above is clearly worth looking at and thinking about.

Monday, September 19, 2011

The President's Proposal

Although I’m sure more detail will emerge in the next week or so, I thought it might be helpful to share a few thoughts on the President’s proposal this morning regarding the deficit.

Political Theater

Perhaps the most important thing to understand is that the proposal is not intended to actually result in any meaningful legislation.  Indeed, the White House has admitted that, saying that the President would not be offering up any of the items tentatively agreed to this Summer with Speaker Boehner and that today’s proposal “is a vision and not a legislative compromise being crafted to garner some number of votes in the House and the Senate.” 
In other words, the proposal is not expected to actually result in the making of legislation.

What, then, is its purpose?  The answer is “political positioning.” 

This announcement can be most meaningfully read as the President’s opening move in the 2012 presidential campaign, and is intended, among other things, to position his ultimate Republican opponent as an opponent of additional taxes on the “rich,” however defined.

Legislatively, then, this is merely one proposal which the “supercommittee” will take under consideration; whether any of its elements will be incorporated in any final legislative proposal by that committee (or even whether the supercommittee will be able to reach any agreement) remains to be seen.

Phantom Savings

At least some of the proposed savings are essentially smoke and mirrors.
For example, $1 trillion of the supposed savings is attributed to winding down of the wars in Iraq and Afghanistan, which were already scheduled to be wound down.

Functionally, this is somewhat like my saying that I’ve decided to not buy that new Volvo next year, after I’d already decided a few months ago to not buy that new Volvo, and telling my spouse that I’ve just saved us $40,000.

Political credit?  Maybe.

Actual political courage and associated pain?  No.

Entitlement Shyness

Absent are any real reforms regarding entitlements, such as an increase in the eligibility ages for Medicare or Social Security. 

Note that the President has already cut $500 billion from Medicare as part of ObamaCare by proposing cuts to providers that may not be sustainable and might, if enacted, cause a shortage of providers. 

Nor is the President asking the rich to pay more for their care, by means-testing Medicare benefits.

Also absent are any discussion of other Medicare reforms, such as increased efficiencies, enhanced cost control through competition, etc.

All in all, while the proposal may be an interesting political document, it reflects little of real substance from a legislative standpoint, and may only have, at best, a marginal impact on the supercommittee’s deliberations.